Relaxometry on ilumr
- Sharon McTaggart
- Mar 12
- 5 min read

When we talk about ilumr we often focus on its imaging capabilities. I mean, how cool is it to have a mini desktop MRI machine that lets you look inside all kinds of plants, bugs, and other hydrogen rich samples? But ilumr’s capabilities aren’t limited to imaging. With its short RF pulse lengths and fast recovery time, it’s also a great tool for relaxometry.
What is Relaxometry?
In Nuclear Magnetic Resonance (NMR) and Magnetic Resonance Imaging (MRI), the magnetic moments of hydrogen nuclei are excited using radiofrequency pulses. Directly after excitation, the majority of the magnetic moments are in a high energy state and are in phase with each other. Over time, the magnetic moments dephase, lose energy, and return to an equilibrium state. This process is called relaxation. Relaxometry, or Time-Domain NMR (TD-NMR), is the measurement and analysis of the different rates of relaxation in a sample. Since relaxation rates are affected by local molecular environments, structural environments, and diffusion, analysing the complex patterns of relaxation can give us information about a sample's molecular composition, macroscopic structures, and fluid transportation mechanisms.
What is Relaxometry used for?
Relaxometry has a wide range of applications in a diverse set of industries and research fields: from the medical field [1][2] to food science [3][4], agriculture [5][6], geology [7], pharmaceuticals [8], material science [9], and more. The popularity of relaxometry is due to a few key factors. First, relaxometry allows for the non-invasive, non-destructive measurement of heterogeneous samples. This means that samples like ready to eat food products, whole produce, plants, soil, fibres, medications, and engineered materials can be continuously evaluated during various stages of processing, growth, storage, or use. Second, relaxometry measurements are less sensitive to inhomogeneity in the measurement device’s main (B0) magnetic field. This allows relaxometry to be performed on smaller, lower power, lower cost devices. The relative portability and affordability of these devices presents opportunities for in-field measurements with relaxometry devices being installed in greenhouses to measure the real time growth of live plants [10] and taken to archeological sites to study historical objects [11]. As the mechanisms of relaxation are researched further and novel pulse sequences and data processing techniques are developed, the applications of relaxometry will continue to grow.
Relaxometry Tools on ilumr
How can you get started in this exciting world of relaxometry? Whether you're prototyping a new relaxometry pulse sequence, measuring samples for a research project, or teaching students about the underlying principles of Magnetic Resonance; the ilumr MR system puts powerful development tools right on your desktop.
ilumr Pulse Sequences
ilumr comes with a range of pulse sequences that can be used for relaxometry experiments (including FID, SE, CPMG, IRCPMG, and SRCPMG). All pulse sequence programs are viewable and editable. You can modify them to add your own timing constraints and preparation modules, or simply use them as an example for developing your own brand-new relaxometry pulse sequences.

ilumr Experiments
On ilumr, relaxometry pulse sequences can be executed using a graphical user interface (GUI) or programmatically.
Running a relaxometry experiment through a GUI is as easy as selecting input parameter values and clicking run. Data from the experiment is automatically processed and displayed. From here, data can be saved for custom data processing. GUI based FID, SE, CPMG, and T1-T2 IRCPMG experiments can be found in the ilumr dashboard sidebar. You can also run T1-T2 IRCPMG and SRCPMG experiments using our GUI based Jupyter Notebooks. If you don't already have these notebooks installed on your ilumr, you can download them from our GitHub.
Running relaxometry experiments programmatically allows for more fine tuned control. Loading parameters and pulse sequences, running the experiment, and processing and saving data are user defined in python. Programmatic versions of our T1-T2 IRCPMG and SRCPMG Jupyter Notebooks are also available for download on our GitHub. These notebooks can be used to run standard experiments or modified to create your own custom relaxometry notebooks.


Example Relaxometry Data
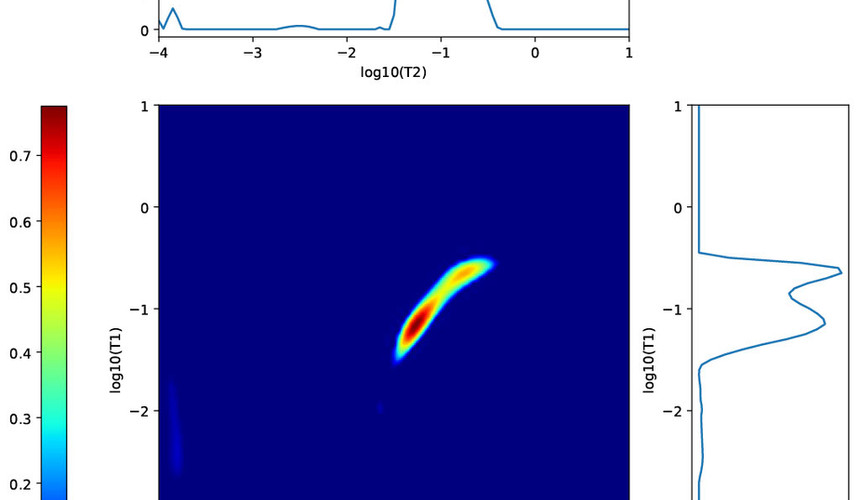
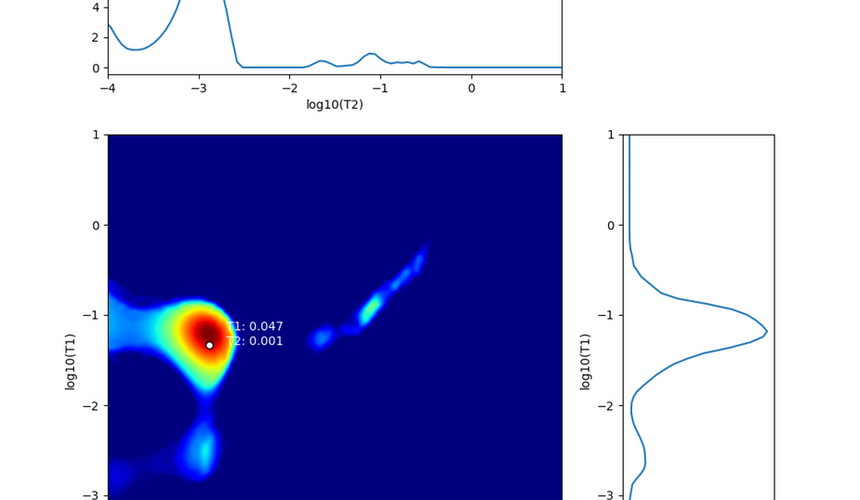
The image gallery below shows a collection of T1-T2 Correlation Maps for some of the seeds and food samples we've measured using ilumr.
ilumr T1-T2 Correlation Map Image Gallery


An application note on the use of ilumr to characterise the T1, T2, and diffusion properties of samples for MRI phantom development can be found below.
Join the Discussion!

Our forum is a great place to discuss topics with the Resonint team and other ilumr users. If you need a hand getting started with a relaxometry project, want to see some relaxometry data for a specific sample, or have some interesting information to share about your experience with relaxometry; send us a message in the "General" topic!

If you have questions about our product range, are interested in receiving a quote, or would like to schedule a product demonstration, send us an email at info@resonint.com.
References
[1] H.-L. Margaret Cheng, N. Stikov, N. R. Ghugre, and G. A. Wright, “Practical Medical Applications of Quantitative MR Relaxometry,” Journal of Magnetic Resonance Imaging, vol. 36, no. 4, pp. 805–824, Sep. 2012.
[2] J. R. Dillman, A. T. Trout, and J. A. Tkach, “Relaxometry: Applications in the Body,” Academic Press, 2020, pp. 215–237.
[3] C. Rondeau-Mouro, “2D TD-NMR Analysis of Complex Food Products,” Springer eBooks, pp. 1483–1502, Jan. 2018.
[4] Tiago Bueno Moraes and Luiz Alberto Colnago, “Noninvasive Analyses of Food Products Using Low-field Time-domain NMR: A Review of Relaxometry Methods,” Brazilian journal of physics, vol. 52, no. 2, Jan. 2022.
[5] T. Monaretto, T. B. Moraes, and Luiz Alberto Colnago, “Recent 1D and 2D TD–NMR Pulse Sequences for Plant Science,” Plants, vol. 10, no. 5, pp. 833–833, Apr. 2021.
[6] Luiz Alberto Colnago et al., “Low field, time domain NMR in the agriculture and agrifood sectors: An overview of applications in plants, foods and biofuels,” Journal of magnetic resonance, vol. 323, pp. 106899–106899, Feb. 2021.
[7] Aliya Mukhametdinova, Iwona Habina-Skrzyniarz, A. Kazak, and Artur Krzyżak, “NMR Relaxometry Interpretation of Source Rock Liquid Saturation — A Holistic Approach,” Marine and petroleum geology, vol. 132, pp. 105165–105165, Oct. 2021.
[8] Z. Freitas, R. Cucinelli, M. I. Tavares, and M. Monteiro, “NMR Relaxometry Applied to Pharmaceutical Forms,” The Pharmaceutical and Chemical Journal, vol. 6, pp. 86–98, Dec. 2019.
[9] D. Besghini, M. Mauri, and R. Simonutti, “Time Domain NMR in Polymer Science: From the Laboratory to the Industry,” Applied Sciences, vol. 9, no. 9, p. 1801, Apr. 2019.
[10] C. W. Windt, M. Nabel, Johannes Kochs, S. Jahnke, and U. Schurr, “A Mobile NMR Sensor and Relaxometric Method to Non-destructively Monitor Water and Dry Matter Content in Plants,” Frontiers in Plant Science, vol. 12, Feb. 2021.
[11] C. Rehorn and B. Blümich, “Cultural Heritage Studies with Mobile NMR,” Angewandte Chemie International Edition, vol. 57, no. 25, pp. 7304–7312, May 2018.
Comments